How many covers on Saturday?
Every restaurant owner asks it on Thursday: how many covers will I do on Saturday night? The answer decides how much meat to order, how many waiters to call in, whether to open the upstairs room.
Almost always the answer is a gut feeling: "same as last Saturday", or "roughly the average of the last few Saturdays". It works well enough, and that's exactly why it's hard to beat.
Mistral recently released Timestral, a family of foundation models for time series. The promise is the same as with LLMs, but for numbers: you give it the history, it gives you the forecast, with no training at all. I wanted to see whether it holds up on a concrete, slightly messy problem like a restaurant's covers.
Spoiler: it works, but not always, and the case where it fails is the most instructive one.
What Timestral is, briefly
A time-series foundation model has already been trained on a huge number of different series (sales, traffic, energy, weather…). It knows nothing about your restaurant, but it has seen enough patterns to recognise seasonality, trends and weekly rhythms in a series it has never met. That's called zero-shot forecasting.
The Timestral features that matter here:
- Four sizes: 5M, 28M, 123M and 209M parameters. The smallest one runs comfortably on a CPU.
- Probabilistic forecasts: it doesn't return a single number but 21 quantiles. So not just "you'll do 120 covers", but also "with 80% probability between 100 and 140".
- Covariates: you can pass extra information, either known only in the past (say, rain over the last few days) or also known in the future (weekday, public holidays, closures).
- Up to 32,768 points of history as input, and up to 1,024 points forecast in a single pass.
- Modified MIT licence, usable on-premise: the restaurant's data doesn't have to go anywhere.
The experiment
The data (simulated, and I'll say so upfront)
I don't have real restaurant data I can publish, so I simulated the history of a Roman trattoria. It's not ideal, but it has one advantage: I know exactly which rules are in there, so I can tell whether the model picked them up.
The history runs from January 2024 to October 2026, one value per day, with these rules:
- about 70 covers as a base, growing 8% a year;
- closed on Mondays; Friday ×1.45, Saturday ×1.7, Sunday ×1.25;
- August at 55%, because Rome empties out; December ×1.2;
- Italian public holidays ×1.35 (Easter included), open even when they fall on a Monday; closed from 24 to 26 December and on 1 January;
- rain on roughly one day in four, ×0.85;
- random noise of about 8%.
On average, on open days, that's about 88 covers.
The questions
I compared Timestral with the two rules a restaurant owner actually uses:
- "Same as last week": the same weekday of the previous week.
- "Average of the last 4": the average of the last 4 matching weekdays (the last 4 Saturdays, and so on).
Every method knows when the restaurant is closed, because an owner does, and the error is measured on open days only. I tried two windows:
- October 2026: 4 ordinary weeks.
- 20 July – 31 August 2025: the hard case, with the August collapse and the mid-August holiday in the middle.
For each, Timestral 5M and 28M in every test, plus 123M and 209M in the full-history tests, with and without the calendar (weekday, holidays and closures as known covariates, rain as a past covariate), and with two amounts of history: everything available, or just the last 8 weeks, like a newly opened place.
So as not to be fooled by a lucky run, I regenerated the data 5 times with different seeds: the numbers below are averages.
The code
It installs from GitHub, and using it is surprisingly short:
pip install git+https://github.com/mistralai/timestral.git
import numpy as np
from timestral import TimestralForecaster

model = TimestralForecaster.from_pretrained("mistralai/Timestral-28M")  # device="cuda" for a GPU

# daily covers, shaped (series, variates, time)
context = covers.astype(np.float32)[None, None, :]

forecast = model.forecast(
    context,
    prediction_length=28,
    known_covariates=holiday_and_closed,      # (1, 2, history + 28): holidays and closures
    categorical_known_covariates=weekday,     # (1, 1, history + 28): day of the week
    past_covariates=rain,                     # (1, 1, history): rain, known only in the past
)

forecast.median          # the "central" forecast
forecast.quantile(0.1)   # lower bound of the 80% interval
forecast.quantile(0.9)   # upper bound
Everything runs on a laptop, CPU only.
Result 1: in an ordinary month, Timestral wins
On October, with almost three years of history, the average error in covers per day is:
- "Same as last week": 10.6
- "Average of the last 4": 9.2
- Timestral 5M: 7.8
- Timestral 28M, 123M and 209M: 7.6
About 17% lower than the best rule, with no training. On 88 covers on average, that means missing by 7-8 people instead of 9-10.
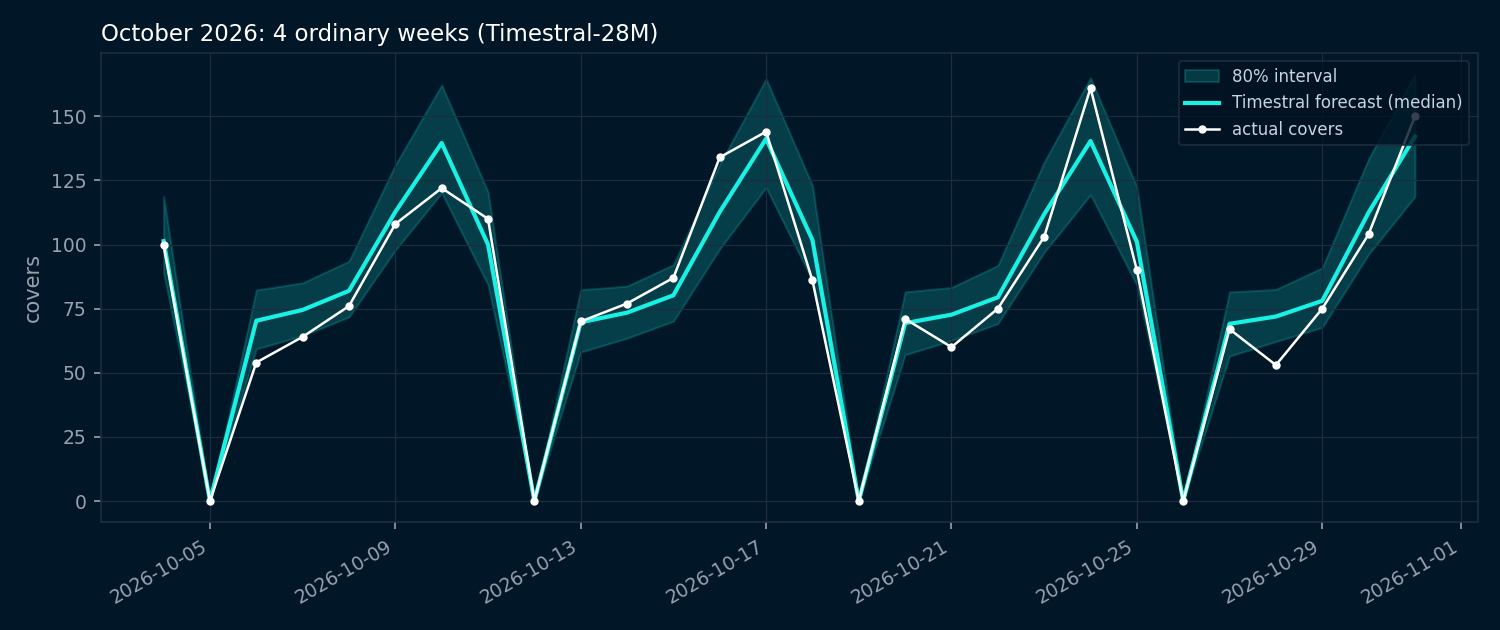
October 2026, Timestral-28M without covariates (dataset seed 42).
Two things struck me more than the average error:
- The intervals are honest. The 80% interval contains the actual value on 81% of the days. That's exactly what it should do, and it's the most useful piece of information for an owner: not "you'll do 120 covers", but "be ready for somewhere between 100 and 140".
- It's very fast. With the small models a 4-week forecast takes between 0.02 and 0.2 seconds on CPU; even the biggest one, the 209M, forecasts 6 weeks in about 0.13 seconds and loads in a second.
And in an ordinary month the sizes are practically level: from 5M to 209M the error stays between 7.6 and 7.8. For a case like this, the smallest model is enough.
Result 2: with little history, the simple rule wins
Same October window, but Timestral only sees the last 8 weeks:
- "Average of the last 4": 9.2
- Timestral 28M with calendar: 9.8
- Timestral 28M: 10.2
- Timestral 5M: 13.4 (and very variable from one dataset to the next: between 8.5 and 20.2)
With two months of data the simple rule is better, or at least no worse. It makes sense: 8 weeks contain 8 Saturdays, and the average of the last 4 Saturdays is already a decent estimate. The model doesn't have enough history to do better.
For a newly opened restaurant, Timestral isn't the first thing to try.
Result 3: August, and the calendar surprise
This is the hard case. From 20 July to 31 August the restaurant loses almost half of its customers, and the rules of thumb fall apart, because "same as last week" doesn't know August is coming. With the full history and no covariates:
- "Same as last week": 35.7
- "Average of the last 4": 35.8
- Timestral 28M: 23.8
- Timestral 123M: 24.2
- Timestral 209M: 12.8
Every size beats the rules, because they saw the previous August in the history and remember it. But here, unlike October, size matters: the 209M's error is 64% lower than the rules of thumb, and almost half the 28M's. And its 80% interval contains the actual value on 86% of the days: it stays honest even in an unusual period, while the 28M's stops at 52%.
Then I gave the model the calendar: weekday, holidays and closures. And the forecast got worse, for every size.
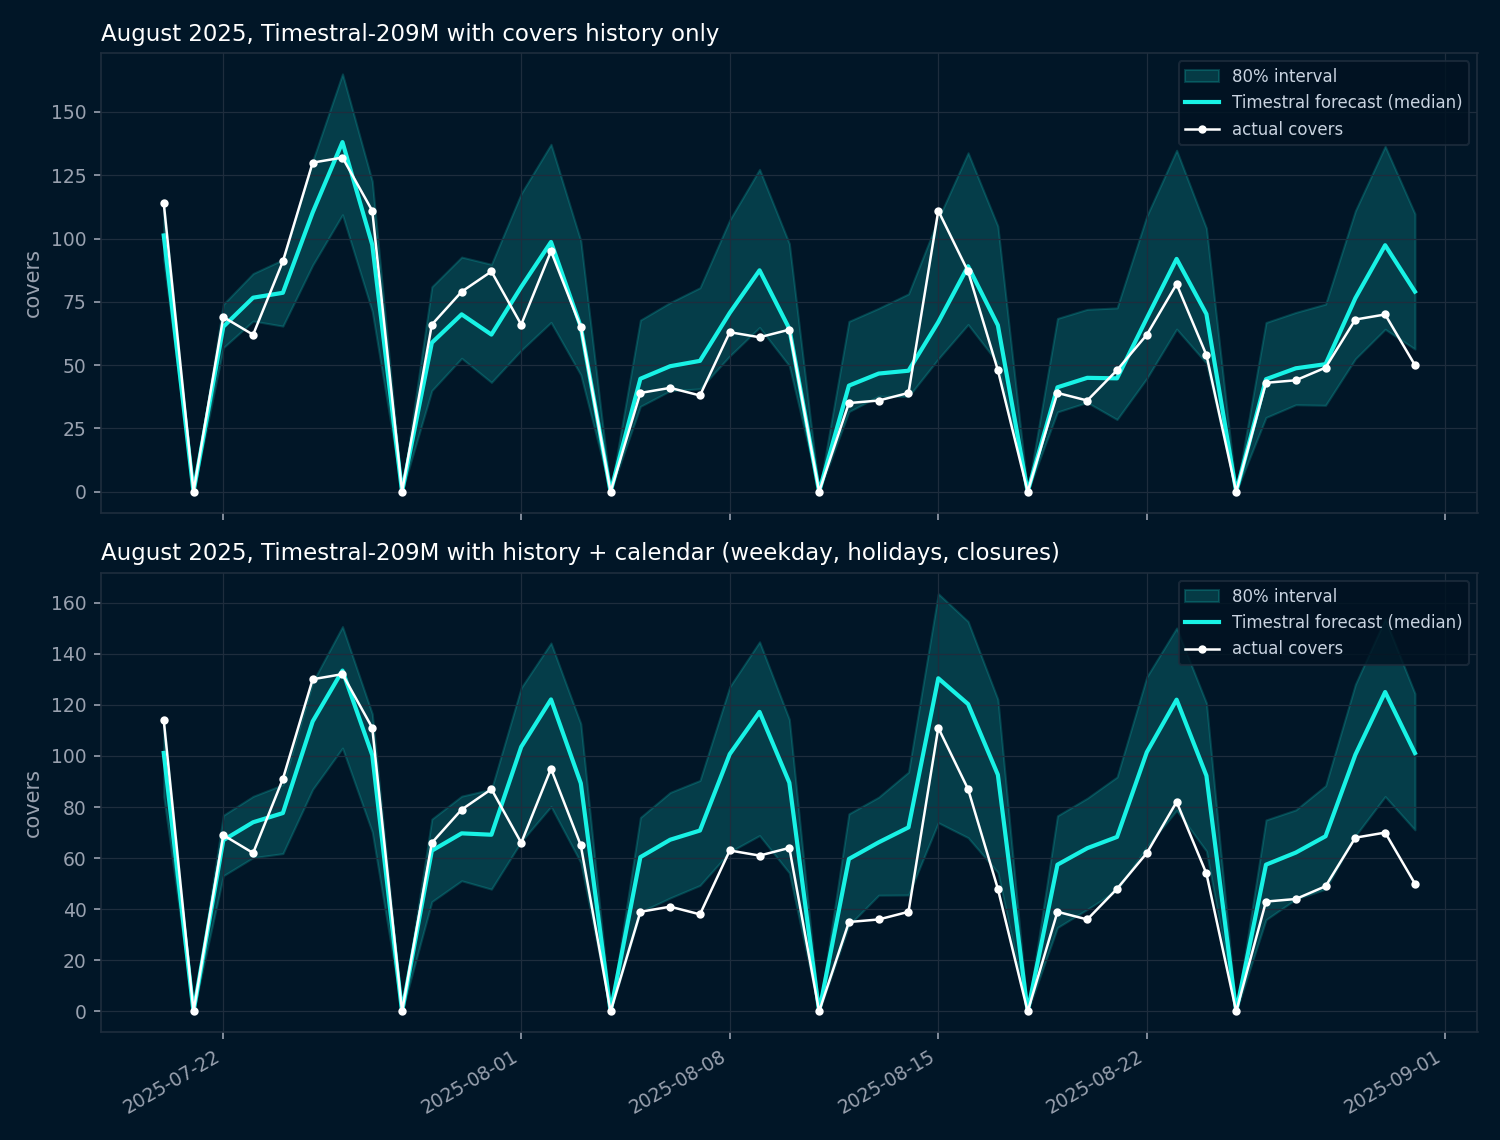
August 2025, Timestral-209M (dataset seed 42). Top: history only. Bottom: history + calendar.
With the calendar, the forecast (bottom) ignores the drop and goes back to drawing July's "typical week". To find out which piece of information does the damage, I reran the test adding one covariate at a time. Average error in August:
- 209M: history only 12.8 · with holidays and closures 16.2 · with the weekday 30.5 · with everything 28.9
- 28M: history only 23.8 · with holidays and closures 29.2 · with the weekday 31.4 · with everything 31.7
The main culprit is the weekday: on its own, it takes the 209M's error from 12.8 to 30.5, almost as bad as the rules of thumb. And it makes the model overconfident: with all covariates, the 80% interval contains the actual value on only 36% of the days for the 209M, and 22% for the 28M. On the small models holidays and closures hurt too, but much less.
Why this happens I can't say for sure: the experiment tells me which covariate does the damage, not the internal mechanism. My interpretation is that the weekday offers the model a shortcut ("Saturday = lots of covers") that makes it give less weight to the previous year's pattern. The weekly rhythm, after all, is already plain to see in the history, so that extra information adds nothing.
The practical lesson is clear: more information doesn't mean better forecasts. Every covariate needs testing, on the hard windows, before it goes to production.
And with only 8 weeks of history in August? Everyone misses by the same amount, between 33 and 36 covers. No model can forecast an August it has never seen.
What it means for a restaurant
If I had to recommend Timestral to a restaurant owner, I'd tell them this:
- You need at least a year of history, two is better. That's where the model makes a difference, especially on seasonal periods.
- For seasonal periods, use the biggest model. In ordinary months the sizes are on par; in August the 209M makes the difference. And on CPU it still costs a fraction of a second.
- Use the interval, not just the number. For ordering perishable stock, the lower bound avoids waste; for staff rotas, the upper bound avoids being caught short. Deciding which bound to use is a different problem, and it's the topic of the next article in this series.
- Don't assume the calendar helps. In my case the weekday made forecasts worse: try with and without, on the difficult weeks.
- It can stay in-house. It runs on CPU in a fraction of a second and the licence allows on-premise use: till data doesn't need to leave the restaurant.
The limits of this test
Better to state them plainly:
- The data is simulated. A real restaurant has events, matches, concerts, group bookings, roadworks outside the door. My simulation rules are clean, and real numbers will be worse for every method.
- One kind of restaurant. A takeaway pizzeria or a tourist spot has very different rhythms.
- I didn't try the weather forecast as a future covariate, which is probably the most useful one of all. Given what happens with the calendar, it would be the first thing to check.
- No tuning. I used the model as it is, and that's the point: I wanted to see what a zero-shot model does.
Conclusion
Timestral does what it promises: with no training, in a fraction of a second and on a laptop, it forecasts covers better than rules of thumb, with honest intervals. In seasonal periods the gap is even bigger, up to 64% less error with the 209M, but only if it has enough history to remember them.
The two things I'm taking away are less obvious: with little history, the simple rule is still unbeatable; and giving the model more information, in my case the weekday, can make it more confident and less accurate at the same time.
This is the first article in a series on AI for restaurants. Coming next:
- from forecast to decision: decision models like Jev and Rizzo Flow, to go from "between 100 and 140 covers" to "call in one more waiter";
- a VLM in the dining room: a model that watches the tables and flags the ones to clear or the ones that have been waiting too long.
The scripts that generate the data and run the experiment are ready: if you'd like to rerun the test on your own restaurant's real covers, get in touch.